Machine Learning

Original Source Here
Linear Regression vs. Logistic Regression
Diving into a comparison of the supervised machine learning algorithm
I am writing this article to make a deep understanding of the similarity and differences between Linear and Logistic regression algorithm and their working with help of their code.
Linear regression
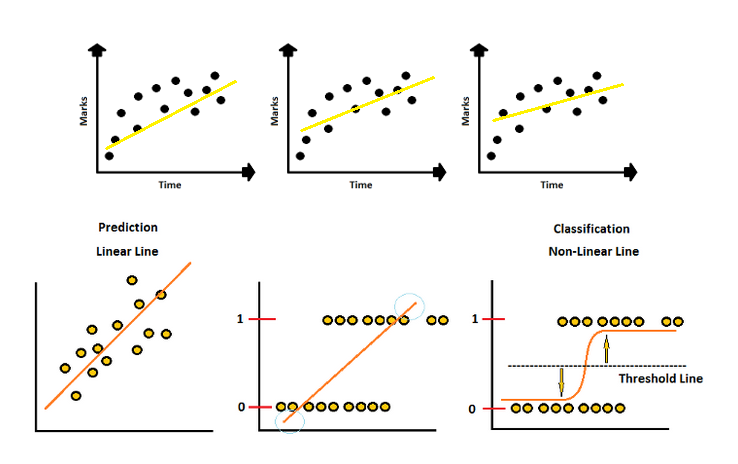
As we know that Linear Regression is a supervised Machine Learning algorithm, is a statistical method which is used to study of relationships between two continuous variables i.e. dependent and independent variable. It also predicts continuous values and finds the best fitting line that describes variables.
Mathematically Linear Regression
One of the classification models, the linear model i.e. Logistic Regression is used to predict categorical data.
Logistic regression
It is an another supervised machine learning algorithm used statistically analyzing a dataset in which there are one or more independent variables that determine an outcome. The outcome is measured with a dichotomous variable (two possible outcomes i.e.1 (TRUE, success, pregnant, etc.) or 0 (FALSE, failure, non-pregnant, etc.).
Also, it uses the concept of probability which is the likelihood or chance of an event occurring.
Logistic Regression Vs Linear Regression
The concept of probability and sigmoid modify the linear regression into the Logistic regression.
Logistic Regression working with the help of probability
Let us have an example of a dataset having age and old-age benefits. Those who have age 35 or more than 35 then are given old-age benefit and those who are below 35 they cannot have given old-age benefit.
We set a threshold value of 0.5 for understanding the working, in given below figure more than 0.5 values have higher chances to given benefit according to the probability values.
Linear Regression and Logistic Regression are similar in the following ways.
- Both are supervised Machine Learning algorithms.
- Both the models are parametric regression means both the models use linear equations for predictions.
Differences
- The continuous values in the target variable are handled by Linear Regression whereas the binary classes in the target column are handled by Logistic regression.
- Linear Regression finds the best-fitted line while Logistic regression is fitting the line values to the sigmoid curve.
- Loss function in linear regression can be calculated by the mean square error method while logistic regression used maximum likelihood estimation.
Code for Linear Regression
#import librariesimport numpy as np
import pandas as pd
import matplotlib.pyplot as pltdatafile=pd.read_csv("salaryData.csv")
print(datafile)
#visualisation usingh scatter plotx=datafile['YearsExperience']
y=datafile['Salary']plt.xlabel('YearsExperience')
plt.ylabel('Salary')
plt.scatter(x,y,color='red',marker='+')
plt.show()
#Splitting of data set in to testing and trainingx=datafile.iloc[:,:-1].values
y=datafile.iloc[:,1].valuesprint(x)
import sklearnfrom sklearn.model_selection import train_test_splitxtrain,xtest,ytrain,ytest=train_test_split(x,y,test_size=1/3,random_state=1)#creating simple linear modelx=datafile.iloc[:,:-1].valuesy=datafile.iloc[:,1].valuesfrom sklearn.linear_model import LinearRegressionmodel=LinearRegression()   #y=ax+b
model.fit(xtrain,ytrain)LinearRegression(copy_X=True, fit_intercept=True, n_jobs=None, normalize=False)#predictiony_pred=model.predict(xtest)
y_pred
#plotting linear regressionplt.scatter(xtrain,ytrain,color='red')
plt.plot(xtrain,model.predict(xtrain))
plt.show()
Code for Logistic Regression
# Importing Libraries and data setimport numpy as np
import pandas as pd
import matplotlib.pyplot as pltdatafile=pd.read_csv(‘LR.csv’)
datafile
X=datafile.iloc[:,[0,1]].valuesY=datafile.iloc[:,2].values#training and testing datafrom sklearn.model_selection import train_test_splitX_train,X_test,Y_train,Y_test=train_test_split(X,Y,test_size=0.25,random_state=0)from sklearn.preprocessing import StandardScalersc=StandardScaler()X_train=sc.fit_transform(X_train)X_test =sc.transform(X_test)
Logistic Regression applying on our training part of data set.
from sklearn.linear_model import LogisticRegressionclassifer=LogisticRegression(random_state=0)classifer.fit(X_train,Y_train)
Predicted value execution
Y_pred=classifer.predict(X_test)# Confusion matrix.from sklearn.metrics import confusion_matrixcm=confusion_matrix(Y_test,Y_pred)cm#output:
array([[65,  3],
      [ 8, 24]])
Accuracy
from sklearn.metrics import accuracy_scoreaccuracy_score(Y_test,Y_pred)#output:
0.89
I hope you like the article. Reach me on my LinkedIn and twitter.
Recommended Articles
1. NLP — Zero to Hero with Python
2. Python Data Structures Data-types and Objects
3. Exception Handling Concepts in Python
4. Why LSTM more useful than RNN in Deep Learning?
5. Neural Networks: The Rise of Recurrent Neural Networks
6. Fully Explained Linear Regression with Python
7. Fully Explained Logistic Regression with Python
8. Differences Between concat(), merge() and join() with Python
9. Data Wrangling With Python — Part 1
10. Confusion Matrix in Machine Learning
AI/ML
Trending AI/ML Article Identified & Digested via Granola by Ramsey Elbasheer; a Machine-Driven RSS Bot
via WordPress https://ramseyelbasheer.io/2021/07/01/machine-learning-6/