Visualizing your deep learning features using TensorBoard
Original Source Here
Introduction
TensorBoard is a tool that provides measurements and visualizations needed during machine learning workflow.
In this tutorial, I will give a quick tutorial on how to visualize your feature vectors on TensorBoard. Using a machine learning model, sometimes we want to learn embeddings of different classes. Embeddings are a way to map different inputs like (images, text, etc) to multi-dimensional vectors. Using TensorBoard, you can visualize the representations or feature vectors. You can also visualize the input data directly. TensorBoard also provides dimensionality reduction methods like PCA and t-SNE. You can easily apply PCA and t-SNE to your data with just one click and see visualizations both in 2D and 3D.
What is the Problem Statement?
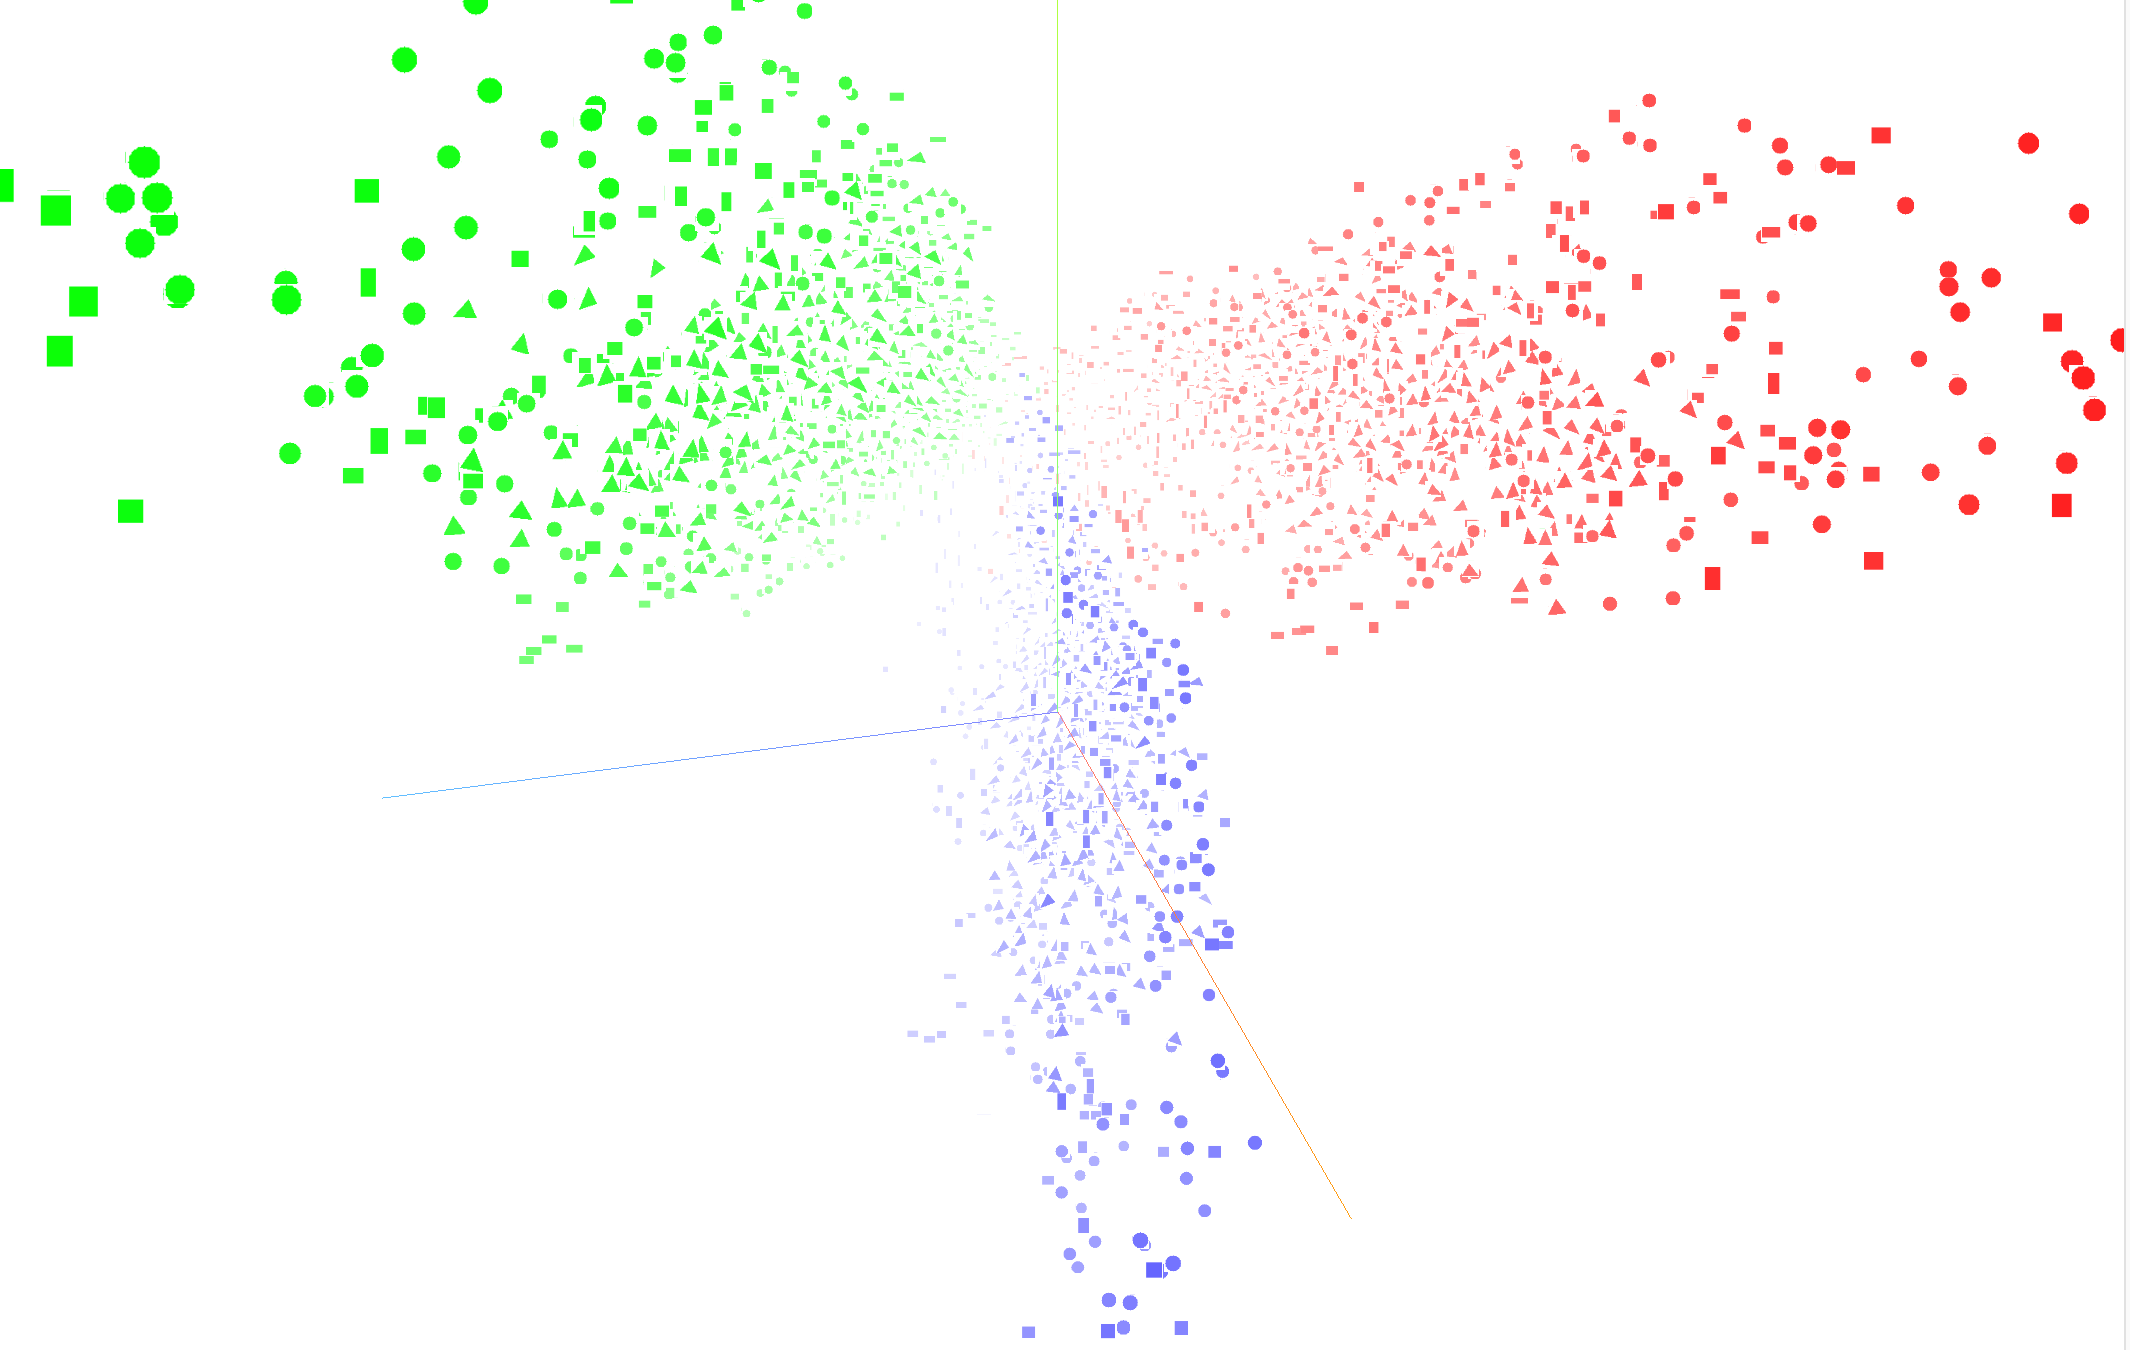
We have a small dataset of different shapes (circle, triangle, rectangles) of different colors (red, green, blue). Let’s say we want to classify shapes based on colors. So, there are 3 target outputs: red, green, and blue. Using a machine learning model, we have learned a representation/ embedding for colors while classifying them. Now, we want to see how effective those representations are?
So, we will visualize these embeddings on TensorBoard.
Below is the dataset that is used.
Requirements
Note: We will use tensorflow.contrib, that’s why version 1.13.2 is required. In version 2.0, it does not exist anymore.
Implementation
- Create a visualization without sprites.
Sprites are blocks of several images arranged in form of a grid. Check out the image below for an example. Sprites make the visualization more impressive and intuitive.
Firstly, I will go through each step to create the code. After this, the complete code is also available. You can directly jump to that if you just want to use it.
Step 1: Firstly, import the libraries.
Step 2: Setup metadata, model, and checkpoint paths.
Step 3: Setup file writer and configurations.
Step 4: Write data to plot in CKPT format
Step 5: Write metadata in TSV format
In the TSV file, labels are written corresponding to the data indices. After this step, we are ready to plot.
Here is the complete code:
Steps to run:
- Open terminal and type: python visualize_without_sprite.py
- Now, type: tensorboard — logdir #YOUR_LOG_DIR_PATH# — host=127.0.0.1
Now, open the localhost on the web browser. And, you will see TensorBoard now.
Output visualization on TensorBoard is shown below.
AI/ML
Trending AI/ML Article Identified & Digested via Granola by Ramsey Elbasheer; a Machine-Driven RSS Bot
via WordPress https://ramseyelbasheer.wordpress.com/2021/03/07/visualizing-your-deep-learning-features-using-tensorboard/


