Visualizing Keras Models
Original Source Here
Visualizing Keras Models
Create an Image of the Model Summary
Have you ever wondered how your neural network is actually connecting different neurons? Wouldn’t it be nice if you can visualize the model architecture that you have designed? Wouldn’t it be nice if you can download your model architecture as an image that you can use while presenting? If you have a YES for all of this then you are at the right place.
In this article, I will show you an exciting python package/module/library which can be used to visualize your Keras models. Whether it is a convolutional neural network or an artificial neural network this library will help you visualize the structure of the model that you have created.
Keras Visualizer is an open-source python library that is really helpful in visualizing how your model is connected layer by layer. So let’s get started.
Installing Keras Visualization
We will install Keras Visualization like any other python library using pip install. We will be using Google Collab for this article, so you need to copy the command given and run it in google collab to install the library.
!pip3 install keras-visualizer
Creating a Neural Network Model
For understanding this article you should have a basic understanding of how to create a Neural Network, for a basic understanding of how neural networks work go through the article below.
Now let’s create a basic Artificial Neural Network using Keras and its functions. In this neural network, I will take input shape as (784,) and design it accordingly, you can make your own network because here we are not learning how to make NN we are just visualizing the final model we have created.
from keras import models
from keras.layers import Dense, Conv2D, MaxPooling2D, Flatten, Activation
from keras_visualizer import visualizer
from keras import layers
model1 = models.Sequential()
model1.add(Dense(16, input_shape=(784,)))
model1.add(Dense(8))
model1.add(Dense(4))
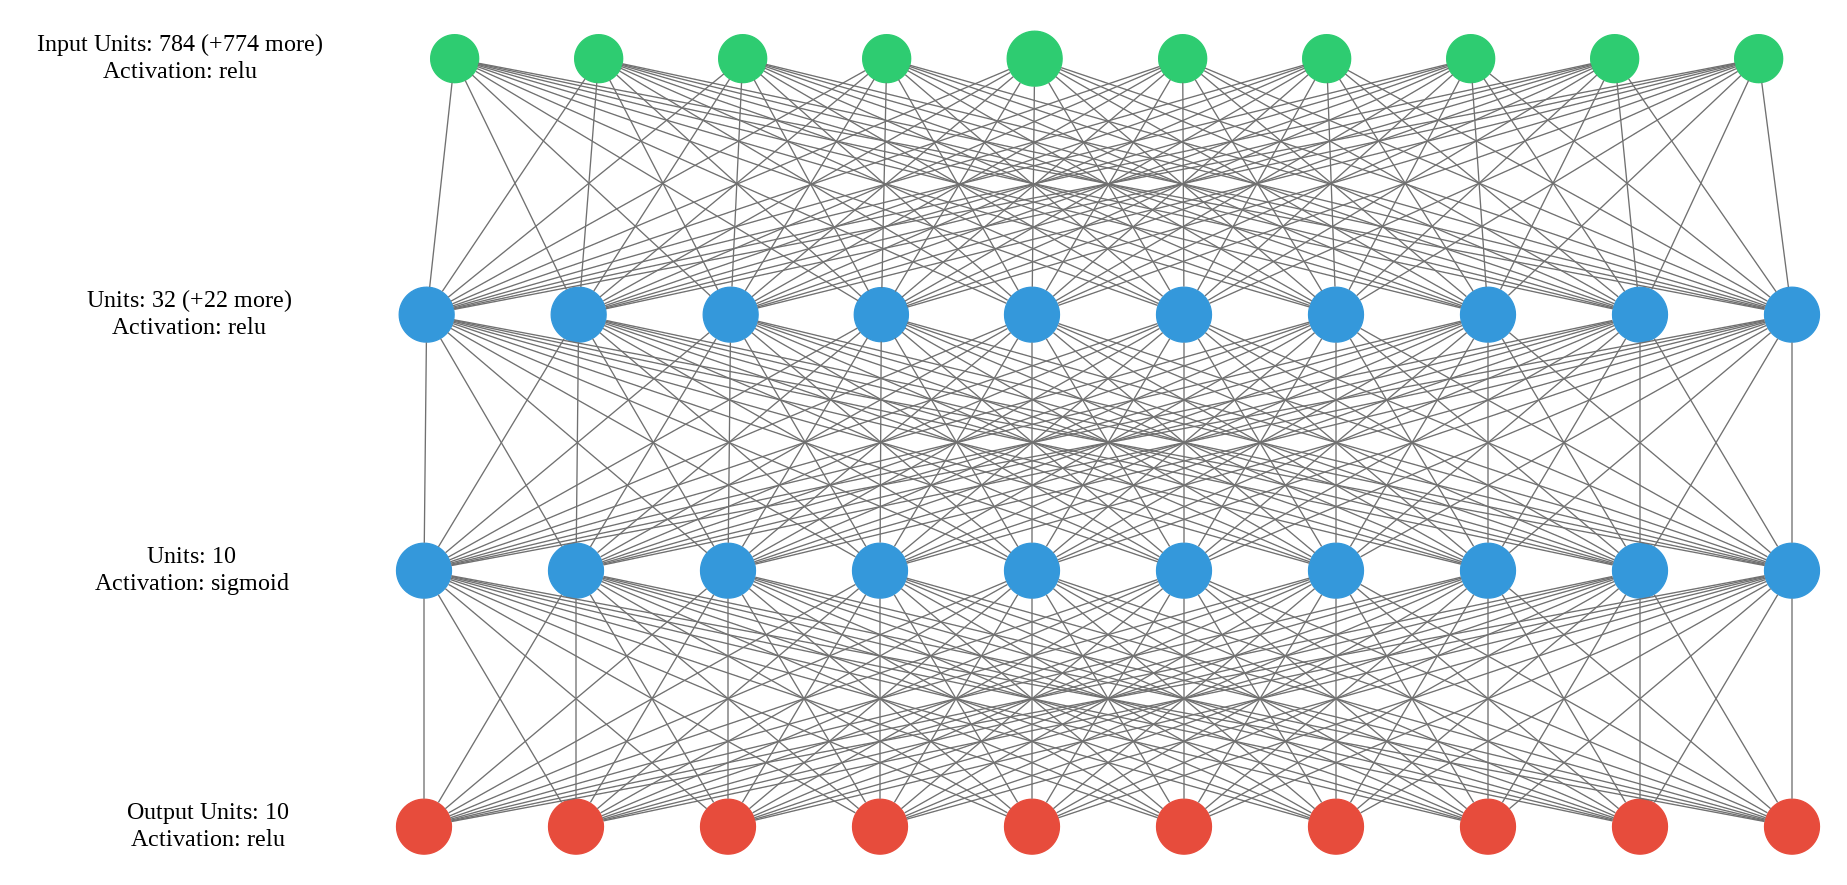
Here in the graph, you can clearly visualize how our model is structured and how different layers are connected to each other with a number of neurons and the activation function of each layer.
Let us visualize a convolutional neural network that will get us a better idea of how this library helps us in visualizing CNN’s.
# Building model architecture
model = models.Sequential()
model.add(Conv2D(8, (3, 3), padding="same",input_shape=(224,224,3), activation="relu"))
model.add(MaxPooling2D(pool_size=(3, 3)))
model.add(Conv2D(16, (3, 3), padding="same", activation="relu"))
model.add(MaxPooling2D(pool_size=(2, 2)))
model.add(Conv2D(32, (3, 3), padding="same", activation="relu"))
model.add(MaxPooling2D(pool_size=(2, 2)))
model.add(Flatten())
model.add(Dense(32, activation="relu"))
model.add(Dense(10))
model.summary()

visualizer(model, format='png', view=True)
Here you can clearly see what all operations are performed at different layers with the number of filters, filter size, no. of neurons, etc.
This is how you can use Keras Visualizer for visualizing your deep learning models. Go ahead try this and let me know your experiences in the response section.
This article is in collaboration with Piyush Ingale.
Before You Go
Thanks for reading! If you want to get in touch with me, feel free to reach me on hmix13@gmail.com or my LinkedIn Profile. You can view my Github profile for different data science projects and packages tutorials. Also, feel free to explore my profile and read different articles I have written related to Data Science.
AI/ML
Trending AI/ML Article Identified & Digested via Granola by Ramsey Elbasheer; a Machine-Driven RSS Bot
via WordPress https://ramseyelbasheer.wordpress.com/2021/02/03/visualizing-keras-models/


