Correlation and its Types in Statistics

Original Source Here
Correlation and its Types in Statistics
Statistics help to understand the behaviors in machine learning
In this article, we will discuss the correlation between variables to observe the dispersion of the data. A wide view of the data graph gives insights to pick the valuable machine learning algorithm for the best fit. The machine learning algorithms are differentiated based on linear, non-linear, density, and cluster.
The correlation (co-variation) divided into parts as shown below:
- Observing if there is a relationship between variables or not.
- If the correlation exists, then how significant it is they with each other.
- The reason of cause and effect relation.
Types of correlation in variables
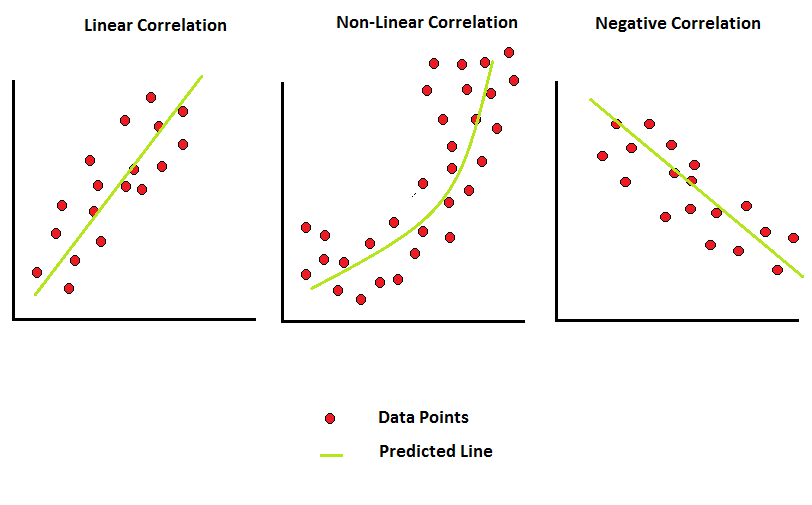
- Positive: This type of correlation is based on the increasing movement of both data variables with each other based on increasing mean.
- Negative: This type of correlation is based on when one variable is increasing and the other is decreasing or vice-versa.
- Simple: Relationship between two variables only.
- Multiple: This type of relationship depends on various variables.
- Linear: When the relationship is based on the constant ratio difference change of both variables to each other.
- Non-Linear: When the relationship is not based on the constant ratio difference change of both variables to each other.
Some methods are used to study correlation as shown below:
- Scatter method
- Graphic method
- Karl Pearson’s coefficient of correlation
- Concurrent deviation method
Scatter Method
In scatter, we seek to find information through the diagram. It is the simplest form of the diagram to check the relation between two variables. It is to be noticed from the diagram that the dot points are scattered and they show us information with their movement.
- An upside-increasing movement forms a positive correlation.
- A downside decreasing movement form a negative correlation.
- The dispersion of dot points everywhere forms no correlation between them.
The one main problem with scatter plot is that we can not calculate the proper degree of correlation because it is not based on the mathematical method.
Graphic Method
In this type of method, the correlation is related to line graphs or with other types of graphs. In the graph approach, both the variable’s points are placed in the graph to check the closeness and direction of both variables. This type of method is useful in time series.
In this method also we do not get a correlation value.
Karl Pearson’s Method
This method gives the mathematical value of the relationship between two variables. The symbol given to this value is “r” which tells the degree of correlation. One thing we have to be clear in this approach that the value “r” gives the correct value when we calculate the deviation of items with the actual mean.
r = the correlation coefficient
X = (X-X^)
Y = (Y-Y^)
N = Numbers of pairs of observations
Sigma x = standard deviation of variable x
Sigma y = standard deviation of variable y
The range of value of r comes between “-1” to “+1” and it tells the direction also with value. For example, the value +0.85 means it is positively correlated and the value -0.43 means it is negatively correlated.
- Pearson’s method assumes that the variables are linear correlated.
- When the coefficient calculates on assumed mean then it affects the relationship. If the actual mean comes like “24.4352” then the calculation takes a little bit longer.
- This method takes longer than another method to compute.
Concurrent deviation method
In this method, the correlation is calculated based on the difference of movement between two variables. It means that the X variable has numbers that numbers are increasing and decreasing values, same for the variable Y as shown in the below figure:
The formula of the coefficient of correlation in this method is shown below:
Rc = Coefficient of correlation
C = Number of multiplied positive outcomes of both variable direction
M = number of paired observation
Conclusion:
Correlation is very much important in machine learning and statistics to know the relationship between variables.
I hope you like the article. Reach me on my LinkedIn and twitter.
Recommended Articles
2. Python Data Structures Data-types and Objects
3. Python: Zero to Hero with Examples
4. Fully Explained SVM Classification with Python
5. Fully Explained K-means Clustering with Python
6. Fully Explained Linear Regression with Python
7. Fully Explained Logistic Regression with Python
8. Basics of Time Series with Python
AI/ML
Trending AI/ML Article Identified & Digested via Granola by Ramsey Elbasheer; a Machine-Driven RSS Bot
via WordPress https://ramseyelbasheer.wordpress.com/2021/02/20/correlation-and-its-types-in-statistics/